Evolution is No Game
5/23/18
Evolutionarily Successful
Watch the video and define the term "evolutionarily successful" in your journal on p. 76 titled Evolution.
Evolutionarily Successful
Watch the video and define the term "evolutionarily successful" in your journal on p. 76 titled Evolution.
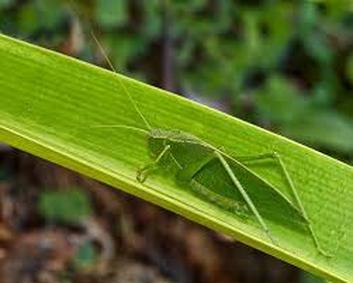
A predator would have a very hard time seeing this grasshopper. The grasshopper’s coloring has undergone natural selection so that it matches the ground surface.
Why It Matters
Why It Matters
- For an animal to live long enough to have babies, it can’t get eaten.
- There are a few ways to do this. You could be big enough or mean enough that you eat the predator first. You could escape by running or swimming very fast.
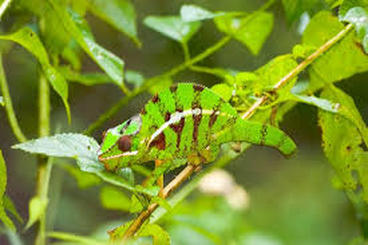
- Another good way is to be camouflaged so that predators can’t see you. How would an animal evolve to match its background? And what happens if the likely background changes?
Explore More
With the link below, learn more about evolution by natural selection. Then answer the following questions in your journal.
This interactive has you change the environment of "living" things to see how random mutations help them survive.
Directions:
Questions:
With the link below, learn more about evolution by natural selection. Then answer the following questions in your journal.
This interactive has you change the environment of "living" things to see how random mutations help them survive.
Directions:
- Use the color selector to change the color of the background (review the questions below first)
- Drag the creatures to empty areas within the habitat to prevent clumping
- If your changes to the environment kill all of the creatures select "start over"
- Creatures will continue to be born as long as you don't kill all of the creatures (remember models are simplified to explain concepts and are not perfect)
Questions:
- As you work through this model keep track of your observations in your science journal. When you are finished, write a paragraph that summarizes your thoughts and observations.
- Which “organisms” are the most likely to survive when the background is yellow?
- If the background is yellow and most of the organisms are yellow, but you change the background to red, what happens to the populations of the yellow organisms and the red organisms?
- What happens to the total population if there are only yellow organisms and you change the background color to purple?
- Why don't all of the organisms that "pop up" match the color of the background?
- Think about the grasshopper in the image in the above article. How did its ancestors evolve to match the background so perfectly?
- Explain what this interactive shows about natural selection and evolution. Be sure to support your answer with evidence (your observations as you used the interactive).
Adaptations and Natural Selection Lab
5/14/18
Variation and Selection in the.. ..Egyptian Origami Bird (Avis papyrus)
INTRODUCTION:
The Egyptian Origami Bird (Avis papyrus) lives in arid regions of North Africa. It feeds on prom dates (Palmus juniorseniorus) and water from Palm Springs. Only those birds which can successfully fly the long distances between the sparsely spaced oases will be able to live long enough to breed successfully. In this lab you will breed several generations of Origami Birds and observe the effect of various genotypes on the evolutionary success of these animals.
MATERIALS:
PREPARATION:
1. Review lab method steps.
2. Clarify any questions.
3. Gather materials.
4. Begin lab.
METHOD:
Step 1
1. Prepare ancestral bird:
Variation and Selection in the.. ..Egyptian Origami Bird (Avis papyrus)
INTRODUCTION:
The Egyptian Origami Bird (Avis papyrus) lives in arid regions of North Africa. It feeds on prom dates (Palmus juniorseniorus) and water from Palm Springs. Only those birds which can successfully fly the long distances between the sparsely spaced oases will be able to live long enough to breed successfully. In this lab you will breed several generations of Origami Birds and observe the effect of various genotypes on the evolutionary success of these animals.
MATERIALS:
- 3 Sheets of Graph Paper
- 1 Roll Tape
- 3 Straws
- 2 Scissors
- 1 Coin
- 1 Six-sided die
- 1 Ruler
PREPARATION:
1. Review lab method steps.
2. Clarify any questions.
3. Gather materials.
4. Begin lab.
METHOD:
Step 1
1. Prepare ancestral bird:
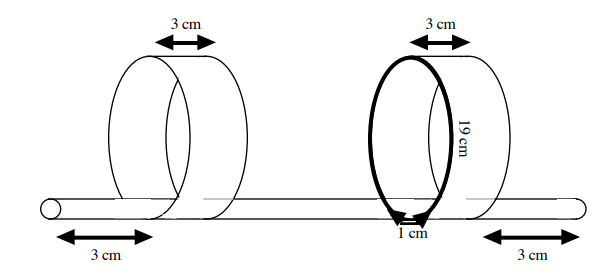
- Cut two strips of paper, each 3 cm x 20 cm.
- Loop one strip of paper with a 1 cm overlap and tape.
- Repeat for the other strip.
- Tape each loop 3 cm from the end of the straw.
Step 2
2. Breed offspring. Each Origami Bird lays a clutch of three eggs.
Record the dimensions of each chick and hatch the birds using these instructions:
a. The first egg has no mutations. It is a clone of the parent.
In the interest of time you will substitute the parent when testing this chick.
b. The other two chicks have mutations.
For each chick, flip your coin and throw your die then record the results on the table.
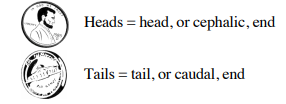
i. The coin flip determines where the mutation occurs: the head end or tail end of the animal:
2. Breed offspring. Each Origami Bird lays a clutch of three eggs.
Record the dimensions of each chick and hatch the birds using these instructions:
a. The first egg has no mutations. It is a clone of the parent.
In the interest of time you will substitute the parent when testing this chick.
b. The other two chicks have mutations.
For each chick, flip your coin and throw your die then record the results on the table.
i. The coin flip determines where the mutation occurs: the head end or tail end of the animal:
ii. The die throw determines how the mutations effect the wings.
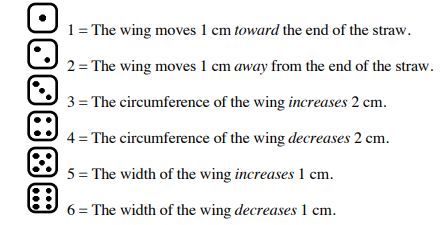
iii. Lethal mutations:
A mutation which results in a wing falling off the end of straw, or in which the circumference of the wing is smaller than the circumference of the
straw, etc. is lethal. Fortunately, Avis papyrus birds are known to “double clutch” when an egg is lost. If you should get a lethal mutation,
disregard it and breed another chick.
Step 3
3. Test the birds.
4. The most successful bird is the one which can fly the farthest.
Mark which chick was the most successful on the table.
5. The most successful bird is the sole parent of the next generation.
Step 4
6. Continue to breed, test, and record data for as many generations as you can in the time allotted.
RESULTS:
Use the table to record the results of your coin flips and die throws, the dimensions of all chicks, and the most successful bird in each generation.
CLEAN UP:
Return lab materials to counter and throw away trash.
DISCUSSION QUESTIONS:
Answer the questions in your journal on p. 75 titled, "Adaptations and Natural Selection Lab." Write or restate the question and answer in complete sentences.
1. Did your experiment result in better flying birds? Explain.
2. Evolution is the result of two processes: variation and selection.
a. How did your experiment produce variation among the offspring?
b. How did your experiment select offspring to breed the next generation?
3. Compare your youngest bird with your neighbor’s youngest bird.
a. Compare and contrast the wings of of other birds with your own.
b. Explain why some aspects of the birds are similar.
c. Explain why some aspects of the birds are different.
4. Predict the appearance of your youngest bird’s descendants if. . . .
a. the selection conditions remain the same and the longest flying bird survives to produce the most offspring.
b. the selection conditions change and now the worst flying bird survives to produce the most offspring.
c. the selection conditions change and the bird whose color blends with its environment survives to produce the most offspring.
A mutation which results in a wing falling off the end of straw, or in which the circumference of the wing is smaller than the circumference of the
straw, etc. is lethal. Fortunately, Avis papyrus birds are known to “double clutch” when an egg is lost. If you should get a lethal mutation,
disregard it and breed another chick.
Step 3
3. Test the birds.
- Standing between the two rows of tables and facing the wall (or cabinets), release the birds with a gentle, overhand pitch.
- It is important to release the birds as uniformly as possible.
- Test each bird twice.
4. The most successful bird is the one which can fly the farthest.
Mark which chick was the most successful on the table.
5. The most successful bird is the sole parent of the next generation.
Step 4
6. Continue to breed, test, and record data for as many generations as you can in the time allotted.
RESULTS:
Use the table to record the results of your coin flips and die throws, the dimensions of all chicks, and the most successful bird in each generation.
CLEAN UP:
Return lab materials to counter and throw away trash.
DISCUSSION QUESTIONS:
Answer the questions in your journal on p. 75 titled, "Adaptations and Natural Selection Lab." Write or restate the question and answer in complete sentences.
1. Did your experiment result in better flying birds? Explain.
2. Evolution is the result of two processes: variation and selection.
a. How did your experiment produce variation among the offspring?
b. How did your experiment select offspring to breed the next generation?
3. Compare your youngest bird with your neighbor’s youngest bird.
a. Compare and contrast the wings of of other birds with your own.
b. Explain why some aspects of the birds are similar.
c. Explain why some aspects of the birds are different.
4. Predict the appearance of your youngest bird’s descendants if. . . .
a. the selection conditions remain the same and the longest flying bird survives to produce the most offspring.
b. the selection conditions change and now the worst flying bird survives to produce the most offspring.
c. the selection conditions change and the bird whose color blends with its environment survives to produce the most offspring.
| origami_bird_data_sheet.docx |
Human Impact
5/3/18
Writing Prompt:
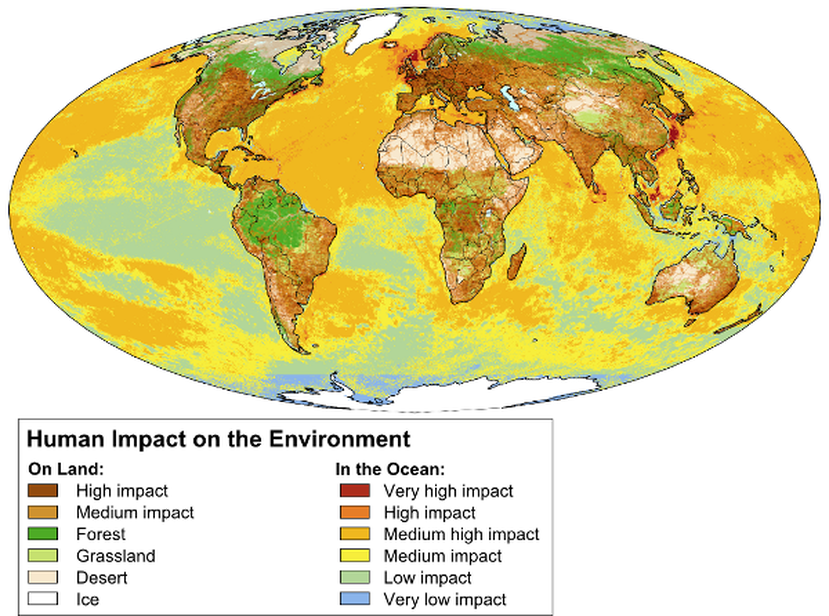
Research and identify 3 ways that human activities are affecting the biome you chose for your project. Write a 5 paragraph essay (APE format) describing in detail the human activities and how they are affecting specific flora or fauna in the biome. Focus your research on both positive and negative impacts.
Use the attached research organizer with scoring rubric to gather your information. Use the APE essay structure for your essay.
Writing Prompt:
Research and identify 3 ways that human activities are affecting the biome you chose for your project. Write a 5 paragraph essay (APE format) describing in detail the human activities and how they are affecting specific flora or fauna in the biome. Focus your research on both positive and negative impacts.
Use the attached research organizer with scoring rubric to gather your information. Use the APE essay structure for your essay.
| human_impact_research_organizer_and_rubric.docx |
Useful Information and Websites
Human Impact Links to Websites
Effects of Climate Change
www.worldwildlife.org/threats/effects-of-climate-change
Effects of Deforestation
www.worldwildlife.org/threats/deforestation
www.worldwildlife.org/threats/deforestation
Effects of Urbanization
urbansprawlawareness.weebly.com/effects.html
urbansprawlawareness.weebly.com/effects.html
Effects of Poaching (Hunting)
www.onegreenplanet.org/animalsandnature/the-devastating-effects-of-wildlife-poaching/
www.onegreenplanet.org/animalsandnature/the-devastating-effects-of-wildlife-poaching/
Effects of Water Pollution
eschooltoday.com/pollution/water-pollution/effects-of-water-pollution.html
eschooltoday.com/pollution/water-pollution/effects-of-water-pollution.html
Effects of Acid Rain
editors.eol.org/eoearth/wiki/Thermal_pollution
editors.eol.org/eoearth/wiki/Thermal_pollution
Videos
Global Warming and Wildlife Video
Wildlife and Loss of Habitat Video
Acid Rain: Its Causes and Effects
The Water Cycle
4/10/18
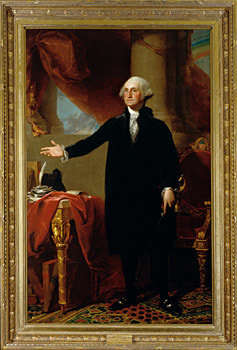
Could you be drinking the same water as George Washington?
Water is recycled constantly through the ecosystem. That means any water you drank today has been around for millions of years. You could be drinking water that was once drunk by George Washington, the first humans, or even the dinosaurs.
The Water Cycle
Whereas energy flows through an ecosystem, water and elements like carbon and nitrogen are recycled. Water and nutrients are constantly being recycled through the environment. This process through which water or a chemical element is continuously recycled in an ecosystem is called a biogeochemical cycle. This recycling process involves both the living organisms (biotic components) and nonliving things (abiotic factors) in the ecosystem. Through biogeochemical cycles, water and other chemical elements are constantly being passed through living organisms to non-living matter and back again, over and over. Three important biogeochemical cycles are the water cycle, carbon cycle, and nitrogen cycle.
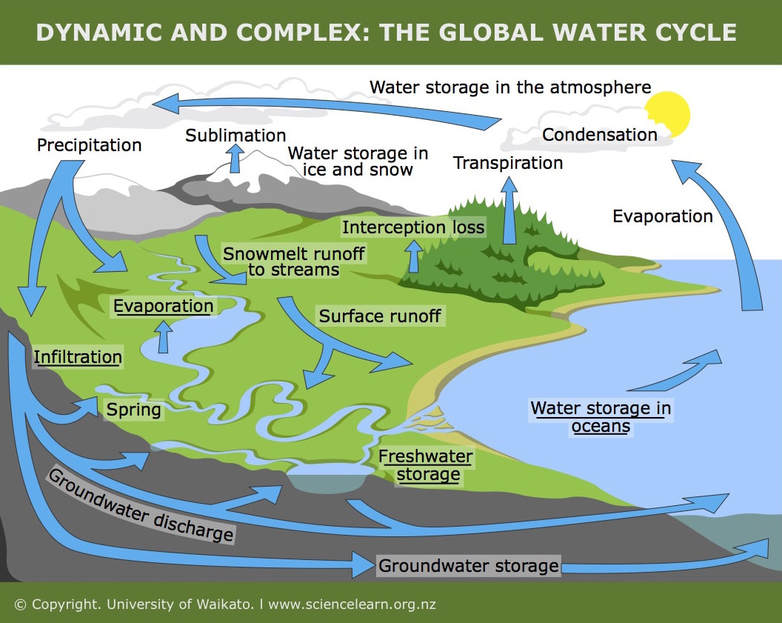
The biogeochemical cycle that recycles water is the water cycle. The water cycle involves a series of interconnected pathways involving both the biotic and abiotic components of the biosphere. Water is obviously an extremely important aspect of every ecosystem. Life cannot exist without water. Many organisms contain a large amount of water in their bodies, and many live in water, so the water cycle is essential to life on Earth. Water continuously moves between living organisms, such as plants, and non-living things, such as clouds, rivers, and oceans (Figure below).
The water cycle does not have a real starting or ending point. It is an endless recycling process that involves the oceans, lakes and other bodies of water, as well as the land surfaces and the atmosphere. The steps in the water cycle are as follows, starting with the water in the oceans:
Run-off
Most precipitation that occurs over land, however, is not absorbed by the soil and is called runoff. This runoff collects in streams and rivers and eventually flows back into the ocean.
Transpiration
Water also moves through the living organisms in an ecosystem. Plants soak up large amounts of water through their roots. The water then moves up the plant and evaporates from the leaves in a process called transpiration. The process of transpiration, like evaporation, returns water back into the atmosphere.
Could you be drinking the same water as George Washington?
Water is recycled constantly through the ecosystem. That means any water you drank today has been around for millions of years. You could be drinking water that was once drunk by George Washington, the first humans, or even the dinosaurs.
The Water Cycle
Whereas energy flows through an ecosystem, water and elements like carbon and nitrogen are recycled. Water and nutrients are constantly being recycled through the environment. This process through which water or a chemical element is continuously recycled in an ecosystem is called a biogeochemical cycle. This recycling process involves both the living organisms (biotic components) and nonliving things (abiotic factors) in the ecosystem. Through biogeochemical cycles, water and other chemical elements are constantly being passed through living organisms to non-living matter and back again, over and over. Three important biogeochemical cycles are the water cycle, carbon cycle, and nitrogen cycle.
The biogeochemical cycle that recycles water is the water cycle. The water cycle involves a series of interconnected pathways involving both the biotic and abiotic components of the biosphere. Water is obviously an extremely important aspect of every ecosystem. Life cannot exist without water. Many organisms contain a large amount of water in their bodies, and many live in water, so the water cycle is essential to life on Earth. Water continuously moves between living organisms, such as plants, and non-living things, such as clouds, rivers, and oceans (Figure below).
The water cycle does not have a real starting or ending point. It is an endless recycling process that involves the oceans, lakes and other bodies of water, as well as the land surfaces and the atmosphere. The steps in the water cycle are as follows, starting with the water in the oceans:
- Water evaporates from the surface of the oceans, leaving behind salts. As the water vapor rises, it collects and is stored in clouds.
- As water cools in the clouds, condensation occurs. Condensation is when gases turn back into liquids.
- Condensation creates precipitation. Precipitation includes rain, snow, hail, and sleet. The precipitation allows the water to return again to the Earth’s surface.
- When precipitation lands on land, the water can sink into the ground to become part of our underground water reserves, also known as groundwater. Much of this underground water is stored in aquifers, which are porous layers of rock that can hold water.
Run-off
Most precipitation that occurs over land, however, is not absorbed by the soil and is called runoff. This runoff collects in streams and rivers and eventually flows back into the ocean.
Transpiration
Water also moves through the living organisms in an ecosystem. Plants soak up large amounts of water through their roots. The water then moves up the plant and evaporates from the leaves in a process called transpiration. The process of transpiration, like evaporation, returns water back into the atmosphere.
Watch the video below, then use the video to answer the questions that follow.
Write the questions on page 67 in your journal, then answer them. Title it "Water Cycle Video"
Add the vocabulary terms to your journal on page 68. Title it "Water Cycle Vocabulary"
Vocabulary Term Definition
aquifer Underground layer of rock that stores water.
biogeochemical cycles Process through which water or a chemical element is continuously recycled.
carbon cycle Pathways through which carbon is recycled through the biosphere.
condensation Process in which water vapor changes to tiny droplets of liquid water.
groundwater Underground water reserves.
nitrogen cycle Pathways through which nitrogen is recycled through the biosphere.
precipitation Water that falls from clouds in the atmosphere to Earth's surface, such as rain, snow, and sleet.
runoff Precipitation that is not absorbed by the soil and flows over the surface of the ground.
transpiration Process in which plants give off water vapor.
water cycle Interconnected pathways through which water is recycled through the biotic and abiotic components of the biosphere.
- What is a fundamental difference between the water cycle and other nutrient cycles?
- What drives the water cycle? Where does this process primarily occur?
- What happens to most of the water taken up by plants? How does this compare to most of the water taken up by animals?
- How does water's role in photosynthesis explain increased biological productivity in areas of heavy precipitation?
Add the vocabulary terms to your journal on page 68. Title it "Water Cycle Vocabulary"
Vocabulary Term Definition
aquifer Underground layer of rock that stores water.
biogeochemical cycles Process through which water or a chemical element is continuously recycled.
carbon cycle Pathways through which carbon is recycled through the biosphere.
condensation Process in which water vapor changes to tiny droplets of liquid water.
groundwater Underground water reserves.
nitrogen cycle Pathways through which nitrogen is recycled through the biosphere.
precipitation Water that falls from clouds in the atmosphere to Earth's surface, such as rain, snow, and sleet.
runoff Precipitation that is not absorbed by the soil and flows over the surface of the ground.
transpiration Process in which plants give off water vapor.
water cycle Interconnected pathways through which water is recycled through the biotic and abiotic components of the biosphere.
Building a Food Web
3/13-14/18
Part A
As you have defined, a food web is a depiction of how energy moves through a community of organisms. Food chains show only a single set of energy transfers, ignoring that many organisms obtain energy from many different sources, and in turn may provide energy to many different organisms. You will be building your own food web in this lab.
Materials: (per table group)
Procedure:
1. Obtain a piece of construction paper to be used as poster paper.
2. Write the first and last names of each person in your group on the upper-right hand corner of your poster. Include the period number and date.
3. Remove the picture cards from the envelope.
4. Find the Color Key card. Use different colors to color each of the triangles on the color card.
5. Paste the Color Key Card on the bottom right corner of the poster paper.
6. Find the sun card and paste it to the upper-left corner of your poster paper.
7. Sort the remaining picture cards into groups according to the following trophic levels: producers, primary consumers, secondary consumers, and
tertiary consumers. For example, plants are producers, snails are primary consumers, crayfish are secondary consumers, and turtles are tertiary
consumers.
8. Color the triangles in the upper right-hand corner of each picture card according to the trophic level that each organism falls under.
9. Decide on 15 picture cards in which to construct a food web. Your food web must have at least two organisms from each trophic level.
10. Arrange the picture cards on your poster paper and then glue them in place. Use arrows to show that energy is passed from one living organism to
another (arrows go from the plant or animal that is eaten to the animal doing the eating).
11. Each student completes the Build A Food Web Activity lab sheet. Turn in lab sheet with your completed group poster.
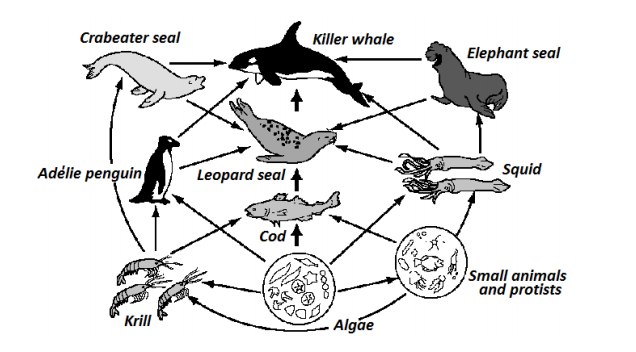
12. An example of a marine food web is shown below.
Continue to Part B below Food Web
Part A
As you have defined, a food web is a depiction of how energy moves through a community of organisms. Food chains show only a single set of energy transfers, ignoring that many organisms obtain energy from many different sources, and in turn may provide energy to many different organisms. You will be building your own food web in this lab.
Materials: (per table group)
- Envelope with Organisms
- 1 Piece of Construction Paper
- Glue
- Colored Pencils
Procedure:
1. Obtain a piece of construction paper to be used as poster paper.
2. Write the first and last names of each person in your group on the upper-right hand corner of your poster. Include the period number and date.
3. Remove the picture cards from the envelope.
4. Find the Color Key card. Use different colors to color each of the triangles on the color card.
5. Paste the Color Key Card on the bottom right corner of the poster paper.
6. Find the sun card and paste it to the upper-left corner of your poster paper.
7. Sort the remaining picture cards into groups according to the following trophic levels: producers, primary consumers, secondary consumers, and
tertiary consumers. For example, plants are producers, snails are primary consumers, crayfish are secondary consumers, and turtles are tertiary
consumers.
8. Color the triangles in the upper right-hand corner of each picture card according to the trophic level that each organism falls under.
9. Decide on 15 picture cards in which to construct a food web. Your food web must have at least two organisms from each trophic level.
10. Arrange the picture cards on your poster paper and then glue them in place. Use arrows to show that energy is passed from one living organism to
another (arrows go from the plant or animal that is eaten to the animal doing the eating).
11. Each student completes the Build A Food Web Activity lab sheet. Turn in lab sheet with your completed group poster.
12. An example of a marine food web is shown below.
Continue to Part B below Food Web
Part B
1. Read pp. 23-28 in Science Explorer: Environmental Science. Answer the questions at the bottom of p. 28 in your journal (p. 63 titled "Studying
Populations."
2. Write the question and the answer for each of the 5 questions.
1. Read pp. 23-28 in Science Explorer: Environmental Science. Answer the questions at the bottom of p. 28 in your journal (p. 63 titled "Studying
Populations."
2. Write the question and the answer for each of the 5 questions.
Building an Energy Pyramid
3/6/18
Write all answers on the lab sheets.
Be careful with the water. Computers and water don't mix!
OBJECTIVES:
ESSENTIAL QUESTIONS:
MATERIALS:
PROCEDURE:
Part I:
1. (On the left of the Energy Pyramid Template): Label each level of the energy pyramid with the appropriate term: producer, primary consumer,
secondary consumer, tertiary consumer.
2. (On the right of the Energy Pyramid Template): Label each level of the energy pyramid with the appropriate term: trophic level 1, trophic level 2,
trophic level 3, trophic level 4.
3. From the Cedar Glade Species List, select 3 organisms to represent each level of the pyramid. Write the name of the organisms in the appropriate
level on the Energy Pyramid Template.
Part II:
4. Observe the experimental data in Table 1.
5. Calculate the percent of energy that is transferred from the first trophic level to the second trophic level. Divide the energy by trophic level one and
multiply by 100. This amount is the percent of energy transferred. Remember to add a percent sign.
6. Calculate the percent of energy transferred from trophic level 2 to trophic level 3.
7. Calculate the percent of energy transferred from trophic level 3 to trophic level 4.
Part III:
8. The colored water in the 500ml graduated cylinder represents the energy found in the first tropic level (producers).
9. Line up the 3 smaller graduated cylinders/beaker. Look at your calculations in Table 1: How much energy was transferred from trophic level one to
level two? ___%. Using the pipette, transfer that percentage from the 500 ml graduated cylinder (EX: 10% of 500 is 50 ML) into the first graduated
cylinder.
10. How much energy was transferred from the second trophic level to the third level?___%. Pour that percentage from small cylinder one into cylinder
two.
11. Repeat for the fourth trophic level/beaker three. (Pour from cylinder two)
12. Answer all questions on the Energy Pyramid Data Sheet and Energy Pyramid Template, then turn in.
13. Log off computer, place it back in the cart, and plug it in.
14. Pour all of the water back into the large graduated cylinder of colored water, wipe up any water spills, place small graduated cylinders/beaker, and
calculator back into the table caddies.
Write all answers on the lab sheets.
Be careful with the water. Computers and water don't mix!
OBJECTIVES:
- Construct an energy pyramid to show the flow of energy through the Cedar Glade ecosystem
- Calculate how much energy is transferred from one trophic level to the next trophic level
ESSENTIAL QUESTIONS:
- Can an energy pyramid be constructed to show the flow of energy through the cedar glade ecosystem?
- How much energy is transferred from one trophic level to the next trophic level?
MATERIALS:
- One 500 ml Graduated Cylinder
- 3 clear Beakers/Graduated Cylinders
- One 1-ml Pipette
- Energy Pyramid Template
- Energy Pyramid Data Sheet
- Cedar Glade Species List
- Calculator
- Pen or pencil
PROCEDURE:
Part I:
1. (On the left of the Energy Pyramid Template): Label each level of the energy pyramid with the appropriate term: producer, primary consumer,
secondary consumer, tertiary consumer.
2. (On the right of the Energy Pyramid Template): Label each level of the energy pyramid with the appropriate term: trophic level 1, trophic level 2,
trophic level 3, trophic level 4.
3. From the Cedar Glade Species List, select 3 organisms to represent each level of the pyramid. Write the name of the organisms in the appropriate
level on the Energy Pyramid Template.
Part II:
4. Observe the experimental data in Table 1.
5. Calculate the percent of energy that is transferred from the first trophic level to the second trophic level. Divide the energy by trophic level one and
multiply by 100. This amount is the percent of energy transferred. Remember to add a percent sign.
6. Calculate the percent of energy transferred from trophic level 2 to trophic level 3.
7. Calculate the percent of energy transferred from trophic level 3 to trophic level 4.
Part III:
8. The colored water in the 500ml graduated cylinder represents the energy found in the first tropic level (producers).
9. Line up the 3 smaller graduated cylinders/beaker. Look at your calculations in Table 1: How much energy was transferred from trophic level one to
level two? ___%. Using the pipette, transfer that percentage from the 500 ml graduated cylinder (EX: 10% of 500 is 50 ML) into the first graduated
cylinder.
10. How much energy was transferred from the second trophic level to the third level?___%. Pour that percentage from small cylinder one into cylinder
two.
11. Repeat for the fourth trophic level/beaker three. (Pour from cylinder two)
12. Answer all questions on the Energy Pyramid Data Sheet and Energy Pyramid Template, then turn in.
13. Log off computer, place it back in the cart, and plug it in.
14. Pour all of the water back into the large graduated cylinder of colored water, wipe up any water spills, place small graduated cylinders/beaker, and
calculator back into the table caddies.
Exploring Ecosystems
3/1/18
Write all answers in your journal on p. 58 titled "Exploring Ecosystems"
Do NOT use the internet to answer any of the questions. You should find what you need from the information contained in this lab, your journal, or the textbook.
Part 1
1. Describe/define the word "ecosystem."
2. Which of these three represent an ecosystem: city, forest, aquarium? Explain your reasoning.
3. Focus on the second part of the word ecosystem - "system." What it might mean to look at ecosystems as a system? What processes or components would you look for that act as a system?
4. Look at the Yellowstone Wilderness Area image below. This photo represents an ecosystem. Draw a T-chart on the page and List the biotic factors on one side and abiotic factors of the ecosystem on the other side. List at least 3 factors for each.
Biotic Factors / Abiotic Factors
____________________________ _/____________________________________________
/
/
/
/
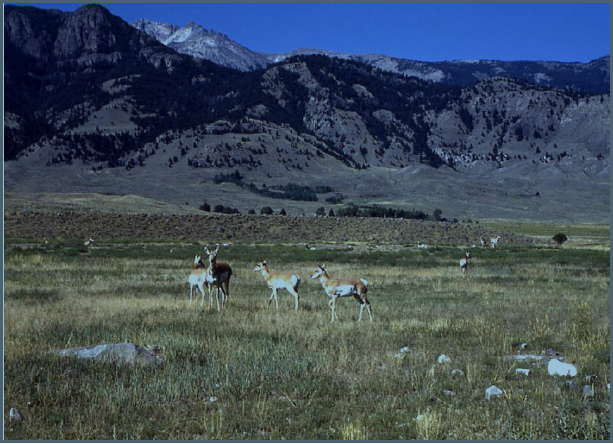
Answer questions 5-8 based on the image above.
5. What is the main source of energy for the ecosystem in the above image?
6. Which kinds of living things can use the energy of the Sun to make their own food?
7. How do other types of organisms obtain their energy?
8. What happens to the matter (bodies) of organisms after they die?
Click on the link below to explore the Antarctic Food Web Game Flash Interactive below to learn more about ecosystems.
- Click on the Food Chains/Webs first and read the information about the flow of energy in food chains/webs.
- Click on Trophic Table next and read the information about producers, consumers, and decomposers.
- Click on Food Web Game last to complete the food web.
Answer the following questions, using the information you got from the Food Chains/Webs, Trophic Table, and Food Web Game.
I. Parts of Ecosystems
9. What is the biotic part of the ecosystem?
10. What is the abiotic part of the ecosystem?
II. Types of organisms in the ecosystem
11. Identify some of the producers in the ecosystem.
12. Identify some of the consumers in the ecosystem.
III. Energy and Matter Within Ecosystems
13. Where does the energy for the ecosystem come from?
14. How is the energy transferred to chemical energy?
15. What happens to the chemical energy of an animal when it is eaten by another animal?
16. How does energy leave the ecosystem?
17. What matter is part of the ecosystem?
18. Where does the matter found in the body of an animal come from?
19. What happens to the matter in the body of an animal after it dies?
IV. Interactions Within Ecosystems
20. Describe three types of relationships between organisms found within an ecosystem. How is energy transferred in each type of relationship? (Think producer, consumer, decomposer, parasitism, symbiosis, competition, etc.)
V. Reflection
21. What defines an ecosystem? Who decides? Why?
Part 2
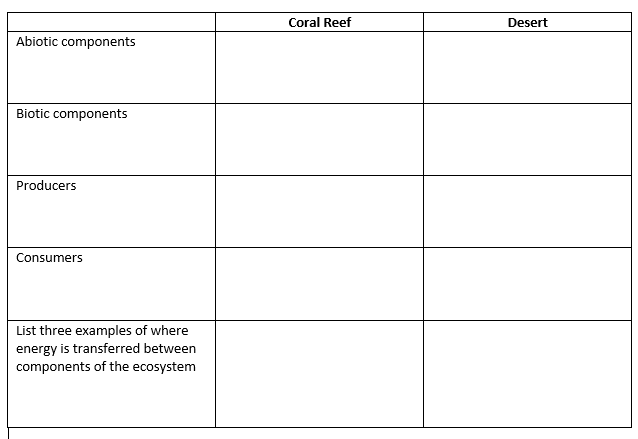
Comparing Ecosystems
Below are an interactive and a video about two different ecosystems. Explore the interactive and the video, then complete the chart in your journal.
I. Parts of Ecosystems
9. What is the biotic part of the ecosystem?
10. What is the abiotic part of the ecosystem?
II. Types of organisms in the ecosystem
11. Identify some of the producers in the ecosystem.
12. Identify some of the consumers in the ecosystem.
III. Energy and Matter Within Ecosystems
13. Where does the energy for the ecosystem come from?
14. How is the energy transferred to chemical energy?
15. What happens to the chemical energy of an animal when it is eaten by another animal?
16. How does energy leave the ecosystem?
17. What matter is part of the ecosystem?
18. Where does the matter found in the body of an animal come from?
19. What happens to the matter in the body of an animal after it dies?
IV. Interactions Within Ecosystems
20. Describe three types of relationships between organisms found within an ecosystem. How is energy transferred in each type of relationship? (Think producer, consumer, decomposer, parasitism, symbiosis, competition, etc.)
V. Reflection
21. What defines an ecosystem? Who decides? Why?
Part 2
Comparing Ecosystems
Below are an interactive and a video about two different ecosystems. Explore the interactive and the video, then complete the chart in your journal.
Fossils Lab
2/15/18
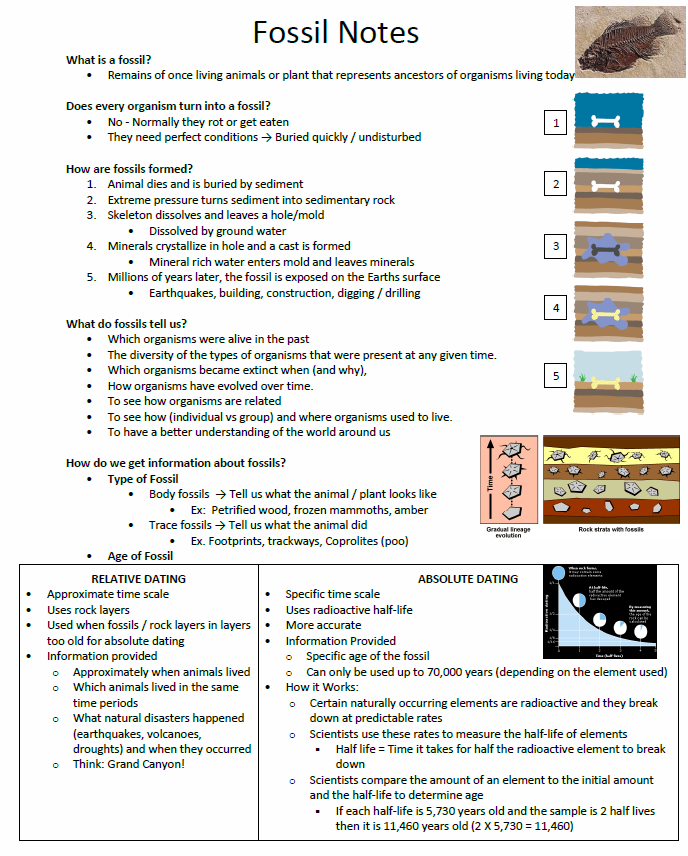
Read the "Fossil Notes" below, then follow the steps to complete the lab.
Do All Organisms Become Fossils?
Fossils are made when a living thing dies and is buried by mud, silt, volcanic ash, or sand. Fossils could also be frozen in ice, mummified in hot or cold deserts, or preserved in tar. Usually, all of a living thing's soft parts decay, leaving only the hard parts to be buried, except when a living thing is frozen or mummified. The mud, silt, and sand are called sediments.
The sediments have water with minerals in it. The minerals in the water soak into the hard parts, changing them into a rock like material and preserving the hard parts as fossils. Living things which die in or near oceans, lakes, or rivers have a better chance of fossilization than those which die on dry land, because they will be quickly buried. Over thousands and millions of years the sediments form heavy layers which slowly turn into sedimentary rock.
Materials: (per group)
- 3 Sugar Cubes
- 2 Pieces of Clay (1 large, 1 small)
- 1 Beaker
- 1 Spoon
- 3 Paper Towels
- Journal (each student)
Procedure:
To minimize cleanup, use the paper towels as your work space.
1. Make sure you have each of the materials listed above.
2. Sugar Cube 1
o Take the larger piece of clay and wrap it tightly around the sugar cube so the entire cube is completely covered, seal any seams
3. Sugar Cube 2
o Take the smaller piece of clay and wrap it around the sugar cube so only HALF the sugar cube is covered
4. Sugar Cube 3
o Leave the third sugar cube alone.
5. Fill the beaker ¾ full of water (Be careful when you turn on the water!)
6. Place the beaker on your paper towel
6. Place all 3 sugar cubes into the beaker of water
7. Stir the cubes in water until the uncovered sugar cube (#3) is dissolved.
8. Using the spoon, remove the other cubes from the water and examine the remains.
9. Observe what happened to each sugar cube and answer the questions below.
Analysis Questions: PLEASE RESTATE AND WRITE IN COMPLETE SENTENCES WITH NO ABBREVIATIONS (ex: b/c).
Add to p. 54 in your journal, titled "Fossils Lab."
1. What happened with sugar cube 1? (What are your observations of both the cube and the clay?)
________________________________________________________________________
2. What happened with sugar cube 2? (What are your observations of both the cube and the clay?)
________________________________________________________________________
3. What happened with sugar cube 3?
________________________________________________________________________
4. When did the clay help to preserve the sugar cube?
________________________________________________________________________
5. Why did this happen?
________________________________________________________________________
6. When did the clay not work to preserve the sugar cube?
________________________________________________________________________
7. Why did this happen?
________________________________________________________________________
8. Explain how this activity is similar to the way fossils are formed in nature.
________________________________________________________________________
9. What needs to occur in nature to an organism in order for it to have a chance to become a fossil?
________________________________________________________________________
10. In nature, what could replace the clay to surround the living organism?
________________________________________________________________________
11. What could happen in nature to prevent an organism from becoming a fossil?
________________________________________________________________________
Rinse out the beaker and spoon, dry them with a paper towel, and place them back with the lab supplies. Place the used clay in the bowl next to the sink. Discard remaining sugar cubes. Use your paper towels to dry the tables.
Continue to Landfill Tech Excavation activity on your desk.
Radioactive Dating - Half-Life Practice
♥ 2/14/18
Read all of the instructions before you begin.
1. Add Half-Life Practice to p. 52 in your journal.
2. Watch the video below.
3. When it gets to the sample half-life problems in the video (around the 8 minute mark), add the sample problems to your journal.
Write the question and the answer for each of the 6 questions. Show any work that is included in the video.
- Pause the video when needed to get all of the information.
4. Read pp. 106-112 in Science Explorer: Earth's Changing Surface.
5. Answer the questions on p. 112 in your journal (p. 53 Fossils).
6. Complete the Valentine's Day word search with any remaining time. ♥♥♥
Skittles Absolute Dating Lab
2/8/18
MATERIALS NEEDED (per group)
- 1 Large cup or container
- 1 Tray
- 100 Skittles
- 1 Decay graph printout (per student)
INSTRUCTIONS
Do NOT eat any of the skittles! They will be reused with each class (and have been used with other classes).
1. Place all your skittles candies with the “S” Facing up on a piece of notebook paper. These represent the parent isotopes.
- If there are any “S” missing on a piece of skittles request another piece so that you have 100 pieces with “S” on them to start the process.
2. Place all the candies that had the "S" facing up in a large container and shake thoroughly. Then, pour all the candies out onto the notebook paper and spread them out.
- This first time of shaking represents one half life. The candies with “S” facing up are the parent isotope and those with the “s” facing down are the
changed daughter isotope. They have lost neutrons to become stable.
3. Set aside ONLY the pieces with the “S” facing down or blank on top. These are the daughter, changed isotope. They will no longer be part of the
process.
Do NOT eat any of the skittles! They will be reused with each class (and have been used with other classes).
4. Count the number of “S” facing up pieces (Parent Isotope).
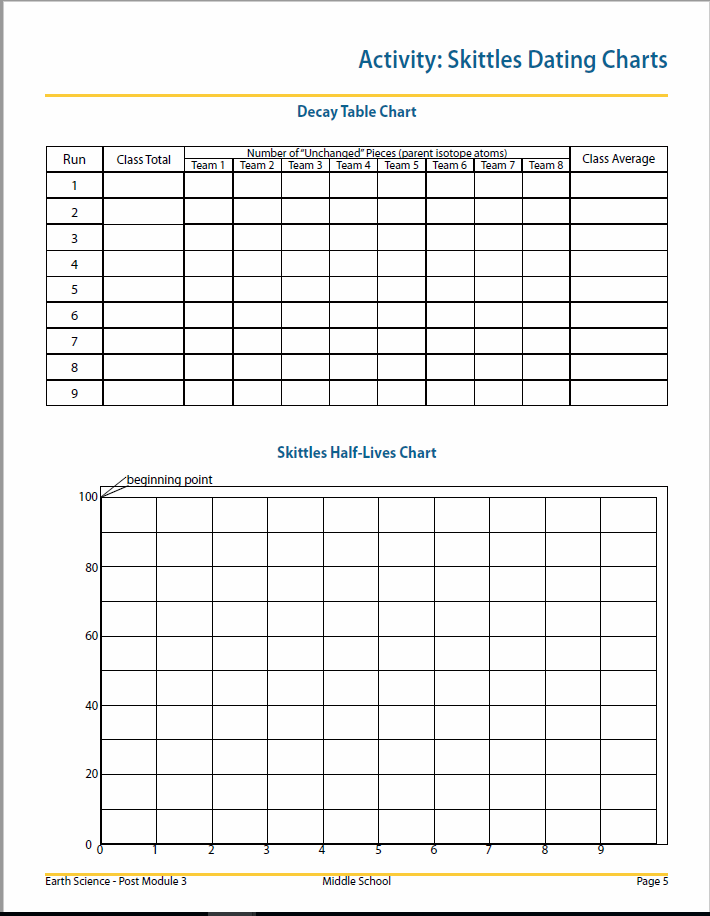
5. Record this number underneath your team number in Row 1 of the Decay Table Chart and write your number on the class chart projected on the
screen.
- These are the unchanged pieces or parent isotope.
6. Repeat steps 2-5 to find information for your Team for each row of the Decay Table chart.
- Each time shake only the parent isotopes that are left. Each shake represents another half life period.
Do NOT eat any of the skittles! They will be reused with each class (and have been used with other classes).
7. Once you have finished gathering your research, plot your results on the Skittles Half Lives Chart and connect each point with a line.
8. On the same graph, your team should plot the Average Values of the whole class and connect those points with a different color. (Be sure to label your
graph lines.)
9. Also on the graph, each Team should plot points where, after each shake the starting numbers is divided by exactly two and connect these points with
a differently colored line. (This line begins at 100; the next point is 100/2, or 50; the next point is 50/2, or 25 and so on.)
10. Return skittles to container and place container on side counter.
Do NOT eat any of the skittles! They will be reused with each class (and have been used with other classes).
Answer the following questions on the back of the Skittles Dating Charts paper.
1. Why didn’t each group get the same results?
_______________________________________________
2. Which results follows the mathematically calculated line best: your single Team’s results or the Class Average results?
_______________________________________________
3. Was it easier to predict results when there were a lot of pieces of candy in the cup, or when there were fewer? Why?
______________________________________________
MATERIALS NEEDED (per group)
- 1 Large cup or container
- 1 Tray
- 100 Skittles
- 1 Decay graph printout (per student)
INSTRUCTIONS
Do NOT eat any of the skittles! They will be reused with each class (and have been used with other classes).
1. Place all your skittles candies with the “S” Facing up on a piece of notebook paper. These represent the parent isotopes.
- If there are any “S” missing on a piece of skittles request another piece so that you have 100 pieces with “S” on them to start the process.
2. Place all the candies that had the "S" facing up in a large container and shake thoroughly. Then, pour all the candies out onto the notebook paper and spread them out.
- This first time of shaking represents one half life. The candies with “S” facing up are the parent isotope and those with the “s” facing down are the
changed daughter isotope. They have lost neutrons to become stable.
3. Set aside ONLY the pieces with the “S” facing down or blank on top. These are the daughter, changed isotope. They will no longer be part of the
process.
Do NOT eat any of the skittles! They will be reused with each class (and have been used with other classes).
4. Count the number of “S” facing up pieces (Parent Isotope).
5. Record this number underneath your team number in Row 1 of the Decay Table Chart and write your number on the class chart projected on the
screen.
- These are the unchanged pieces or parent isotope.
6. Repeat steps 2-5 to find information for your Team for each row of the Decay Table chart.
- Each time shake only the parent isotopes that are left. Each shake represents another half life period.
Do NOT eat any of the skittles! They will be reused with each class (and have been used with other classes).
7. Once you have finished gathering your research, plot your results on the Skittles Half Lives Chart and connect each point with a line.
8. On the same graph, your team should plot the Average Values of the whole class and connect those points with a different color. (Be sure to label your
graph lines.)
9. Also on the graph, each Team should plot points where, after each shake the starting numbers is divided by exactly two and connect these points with
a differently colored line. (This line begins at 100; the next point is 100/2, or 50; the next point is 50/2, or 25 and so on.)
10. Return skittles to container and place container on side counter.
Do NOT eat any of the skittles! They will be reused with each class (and have been used with other classes).
Answer the following questions on the back of the Skittles Dating Charts paper.
1. Why didn’t each group get the same results?
_______________________________________________
2. Which results follows the mathematically calculated line best: your single Team’s results or the Class Average results?
_______________________________________________
3. Was it easier to predict results when there were a lot of pieces of candy in the cup, or when there were fewer? Why?
______________________________________________
Superposition Cupcake Lab
2/1/18
Introduction
It’s not possible to see all the stratigraphic layers in the earth. Landscape features or man-made obstacles often hide some sections of rock. Rather than digging up vast tracts of land to expose an oil field or to find some coal bearing strata, samples can be taken and analyzed to determine the likely composition of the earth’s interior. To approximate in the most accurate way, one of the methods geologists use is that of core sampling, where a drill drives a pipe deep into the bedrock. The core is extracted, and geologists then analyze the rock, measuring it, thinly slicing it, looking at it under a microscope, and numerous other measures of analysis.
Today we will be taking cores just like a geologist, only using a cupcake. You will figure out the “rock” composition of your cupcake to test your predictions.
You will record ALL information in your journals.
Materials (per group)
Procedure
In your journals, log Superposition Cupcake Lab in table of contents and on p. 48. Keep one blank page after your last entry for Earth's History (we will be adding more notes to that page).
1. Make a prediction of what the inside of your cupcake looks like based on what you see on the outside of the cupcake. Draw a picture that demonstrates your prediction. Do NOT unwrap or peel back the cupcake liner.
Introduction
It’s not possible to see all the stratigraphic layers in the earth. Landscape features or man-made obstacles often hide some sections of rock. Rather than digging up vast tracts of land to expose an oil field or to find some coal bearing strata, samples can be taken and analyzed to determine the likely composition of the earth’s interior. To approximate in the most accurate way, one of the methods geologists use is that of core sampling, where a drill drives a pipe deep into the bedrock. The core is extracted, and geologists then analyze the rock, measuring it, thinly slicing it, looking at it under a microscope, and numerous other measures of analysis.
Today we will be taking cores just like a geologist, only using a cupcake. You will figure out the “rock” composition of your cupcake to test your predictions.
You will record ALL information in your journals.
Materials (per group)
- 1 Cupcake
- 3 Sections of Straws
- 1 Knife
- 1 Ruler
- 1 Piece of Paper Towel
- 1 small piece of paper
- Journal (each student)
Procedure
In your journals, log Superposition Cupcake Lab in table of contents and on p. 48. Keep one blank page after your last entry for Earth's History (we will be adding more notes to that page).
1. Make a prediction of what the inside of your cupcake looks like based on what you see on the outside of the cupcake. Draw a picture that demonstrates your prediction. Do NOT unwrap or peel back the cupcake liner.

2. On the small piece of paper, make a compass with North, South, East, and West labeled as shown below.
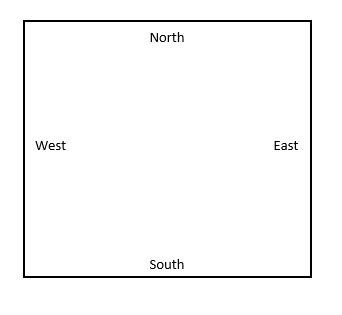
3. Place the cupcake in the center of the compass. Do NOT remove the cupcake from the paper. It needs to be kept in the same alignment for the next steps.
4. Take core samples from the cupcake using your straws. Push one straw into the cupcake from the top all the way to the bottom of the cupcake, twisting slightly, if needed, to get the straw to the bottom (don't go through the paper). Place your finger on the top of the straw opening to seal it, then slowly remove the straw from the cupcake.
5. Now blow lightly on the other end of the straw over your paper towel, so that the core comes out and is on your paper towel.
Do NOT unwrap or cut the cupcake.
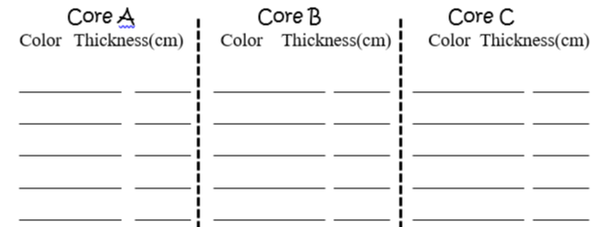
6. Draw the diagram below and record where the core was removed (Sample A) from the cupcake.
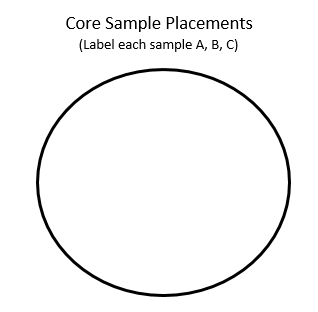
7. Repeat step #4 and #5 to obtain and record placement of two more core samples (Sample B and Sample C). Be sure to take your samples in different locations. Record these core samples on the diagram you drew in step #6.
Don't get your samples mixed up or flipped upside down!
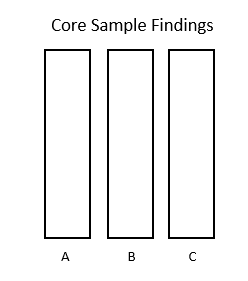
8. Draw the diagram below in your journal. Using colored pencils, draw what each of your core samples looks like. Be sure you keep them in the correct orientation with the bottom of your core sample at the bottom of your diagram.
Don't get your samples mixed up or flipped upside down!
8. Draw the diagram below in your journal. Using colored pencils, draw what each of your core samples looks like. Be sure you keep them in the correct orientation with the bottom of your core sample at the bottom of your diagram.
9. Compare your cores-
a. How are they alike?
b. How are they different?
c. What scientific process could cause this?
10. Measure in centimeters from the bottom of the cupcake core sample the thickness and color of each layer. In your journal, create the data table below and record your samples.
11. Using the information from the 3 core samples, draw a cross-section picture with your colored pencils of what you concluded the inside of the cupcake looks like. Do NOT unwrap or cut the cupcake.
12. Cut the cupcake in half from top to bottom through the center of the cupcake.
13. Draw the diagram below and color in the cross-section of what your cupcake actually looks like on the interior.
14. Eat your cupcake!
Data Analysis:
15. Calculate how old each of your cupcake cores are. Draw the tables below in your journal and complete the information on your core samples using the data you collected in step #10.
Color Age Table:
Color Earth Age (per cm)
Yellow (sand) 5,000 years
Blue (granite) 70,000 years
Green (quartz) 45,000 years
Red (peat) 25,000 years
Core #1:
Thickness (cm) x color age/cm = partial age
_____________ x ______________ = _______________
_____________ x ______________ = _______________
_____________ x ______________ = _______________
_____________ x ______________ = _______________
Total core age = ________________
Core #2:
Thickness (cm) x color age/cm = partial age
_____________ x ______________ = _______________
_____________ x ______________ = _______________
_____________ x ______________ = _______________
_____________ x ______________ = _______________
Total core age = ________________
Core #3:
Thickness (cm) x color age/cm = partial age
_____________ x ______________ = _______________
_____________ x ______________ = _______________
_____________ x ______________ = _______________
_____________ x ______________ = _______________
Total core age = ________________
Total average age of cupcake = _____________
16. Is the stratigraphy (rock layering) exactly like you predicted in step #11? If not, what is different?
17. Explain how your assumptions about the cupcake change as the lab progressed.
a. Cupcake with no information
b. Cupcake with partial information (only one core sample)
c. Cupcake with more information (all core samples considered)
d. Cupcake cut in half
18. Explain how the processes we used on our cupcakes give geologists a full picture of the Earth's rock layers when they use them on the Earth's crust.
Fruit Rollup and Graham Cracker Plate Tectonics
1/11/18
ALL items must be completed by end of class.
1. Open PowerPoint below, read instructions on each slide.
2. Answer all questions in your journal. Label each section (Divergent Plate Boundary, Convergent Plate Boundary (continental to oceanic), Convergent Plate Boundary (continental to continental), Transform Plate Boundary.
| plate_tectonics_fruitrollupgrahamcracker_lab.pptx |
Geologic Time Scale and Earth's Layers
1/4/18
ALL items must be completed by end of class.
Geologic Time Scale
1. Review the Geologic Time Scale chart.
2. Notice how it is divided into eras, periods, and epochs.
3. Each period has a major event (Succession of Life) and Index Fossils associated with it.
4. Review the index fossils and the organisms associated with each period.
5. Cut out reference chart and glue in journal on p. 43.
6. Title entry in your table of contents "Geologic Time Scale Chart."
Earth's Layers
1. Label each layer according to the attached file below.
2. Color each layer according to the attached file below.
| earths_layers_labeled.pdf |
3. Cut out labeled and colored diagram.
4. Cut out Temperature scale in the bottom corner of sheet.
5. Glue both the diagram and temperature scale into your journal on p. 44.
6. Title table of contents entry "Earth's Layers."
7. The definitions for each of the layers are on the Interactives Dynamic Earth website. Click the link below to go to the website.
8. Complete all information - color on diagram and features of each layer.
9. Cut out each rectangle.
10. Glue rectangles on the next blank page in your journal (still numbered p. 44 and titled "Earth's Layers") in the following order:
Oceanic and Continental Crust Lithosphere and Asthenosphere
Upper and Lower Mantle Outer and Inner Core
10. Glue rectangles on the next blank page in your journal (still numbered p. 44 and titled "Earth's Layers") in the following order:
Oceanic and Continental Crust Lithosphere and Asthenosphere
Upper and Lower Mantle Outer and Inner Core
Mendelian Genetics
12/4/17
With your shoulder partner, you are going to review the principles of Mendelian Genetics.
1. Add Mendelian Genetics Video to p. 41 in your journal.
2. Watch introduction to the video.
3. Stop the video when he says to pause (on the page with all of the questions).
4. Write each question and your answers to the questions in your journal on p. 41.
5. Finish watching the video and check your answers.
Meiosis
11/15/17
With your shoulder partner, you are going to investigate the process of meiosis. Follow the instructions below.
With your shoulder partner, you are going to investigate the process of meiosis. Follow the instructions below.
- Each person: Cut out the viewing guide.
- Add Meiosis to p. 36 in your journal.
- Using 8-10 dots of glue per sheet, glue the two pages onto the journal pages.
- You may complete the video guide first and glue it in later if you want.
- Watch and scroll back and forth through Meiosis: The Great Divide to complete the viewing guide.
Mitosis Board Game
11/8/17
After reading "Cell Division" pp. 61-68, you will create a board game that models mitosis with your table partners. To get from "start" to "finish" on the game board, players must advance through each stage of the cell cycle by correctly answering questions about that stage. You have until the end of class to create the game.
1. Create a game board on the large sheet of paper. You may use the diagram on p. 64-65 as a model for your game board.
2. Write playing rules on the lined piece of paper.
3. Write questions on the index cards (1 question per card). You must have 2 questions for each of the 6 steps.
Write the question on one side of the card and the answer on the other side.
4. Tomorrow, groups will trade games and play each other's game.
Note: You will be given a dice and movers to play the game.
Be sure to write all group member's names on the back of the game board and the lined piece of paper.
When the game has been played by another group and has been returned to you, staple the game board, rules, and index cards together and turn into the bin.
Mutations
10/25/17
With your shoulder partner, you are going to investigate the different types of mutations that occur in a cell. Follow the instructions below.
With your shoulder partner, you are going to investigate the different types of mutations that occur in a cell. Follow the instructions below.
- Each person: Cut out the boxes in the handout.
- Add Mutations to p. 31 in your journal.
- Using 8-10 dots of glue per sheet, glue in "What Do You Remember About Mutations" on p. 31 first, then "Amoeba Sisters Video Recap of Mutations: The Potential Power of a Small Change" on the following page (still numbered p.31).
- You may complete the video guide first and glue it in later if you want.
Protein Synthesis
10/20/17
With your shoulder partner, you are going to investigate the differences DNA and RNA, and take a look at the processes of transcription and translation.
With your shoulder partner, you are going to investigate the differences DNA and RNA, and take a look at the processes of transcription and translation.
- Each person: Cut out the boxes in the handout.
- Add Protein Synthesis to p. 28 in your journal.
- Using 8-10 dots of glue per sheet, glue in "Whose Show is This?" on p. 28 first, then "Transcription and Translation" on the following page.
- Next, watch the Amoeba Sisters talk about DNA vs. RNA. Watch and scroll back and forth through the video to answer the questions on "Whose Show is This?"
5. After you finish the questions on DNA and RNA, move on to the second video on that talks about transcription and translation and answer the questions on the Transcription and Translation sheet.
6. Lastly, search a good diagram in GOOGLE images that shows the processes of transcription and translation (all parts must be labeled). Draw and color the diagram on the next page in your journal. Use the rest of class to color in your diagram to make the process come to life!
Pop Bead DNA Model Lab
10/10/17 (6th &7th) 10/11/17 (3rd & 4th) Open the attached document and follow the instructions.
| pop_bead_dna_model_lab.docx |
DNA Phenomena Lab
As we move into our new unit on genetics, let's take a closer look at DNA and how that relates to what we know about cell theory.
Directions: Today you and your shoulder partner will be working together to extract sample pea DNA. In order to do this you and your partner need to first read the background and procedures before beginning the lab.
First, copy these questions in your journal about the background, qualitative observations, and self-reflection (after the lab instructions). Label the page DNA Phenomena Lab (don't forget your table of contents!). You will answer some of these questions as you read and conduct the lab.
Bellringer Questions:
- What are the three parts of cell theory?
- What type of cells do humans have and what do they contain?
- What is DNA?
Qualitative Observations:
4. Write your qualitative data based on what you observe during the lab. Write notes during each step, and be sure to be descriptive.
Background:
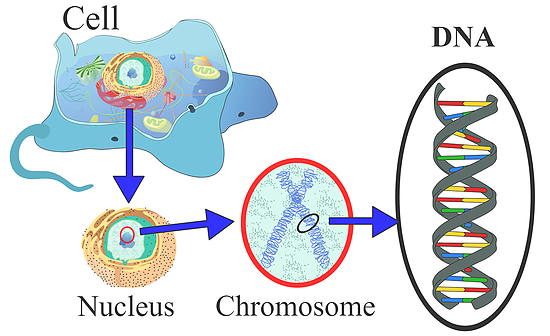
Friday we learned cell theory. Cell theory tells us three important things about cells: 1) All living things are made up of cells. 2) A cell is the smallest unit in a living thing. 3) All cells come from other cells.
Cells found within animals and plants (including you!) are called eukaryotic cells. Eukaryotic cells have a nucleus and organelles contained within a membrane. As we know from our last unit, the nucleus functions as the control center for the cell. Within each nucleus, chromosomes contain DNA. When DNA works correctly, it helps keep the body functioning properly. DNA helps cells to make the substances called proteins, which the cells need to live. DNA also allows living things to reproduce. The genes in DNA pass along physical traits from parents to offspring.
|
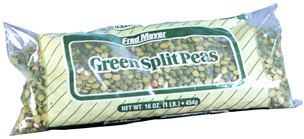
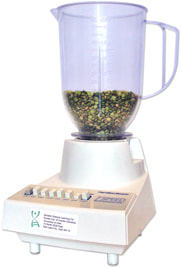
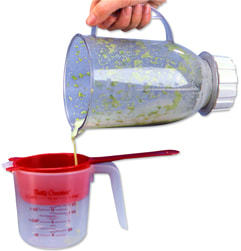
Objectives: To extract DNA from cells. To explain the structure and function of DNA. Materials: 1 Blender, split peas, salt, detergent, water, measuring cup and spoons, strainer, meat tenderizer, alcohol, test tube, glass stirring rod Procedure: (Steps 1-9 have been done for you) 1. First, you need to find something that contains DNA such as split peas. 2. Measure about 100 ml or 1/2 cup of split peas and place them in a blender. 3. Add a large pinch of salt (less than 1 ml or about 1/8 teaspoon) to the blender. 4. Add about twice as much cold water as the DNA source (about 200 ml or 1 cup) to the peas in the blender. 5. Blend on high (lid on) for about 15 seconds. 6. The blender separates the pea cells from each other, so you now have a really thin pea-cell soup. 7. Pour your thin pea-cell soup through a strainer into another container like a measuring cup or beaker. 8. Estimate how much pea soup you have and add about 1/6 of that amount of liquid detergent (about 30ml or 2 tablespoons). 9. Swirl the beaker to mix. (These first steps have been done for you) 10. Let the mixture sit for 5-10 minutes. The detergent captures the proteins & lipids of the cell membrane. 11. Pour the mixture into test tubes or other small glass containers, each about 1/3 full. 12. Add a pinch of enzymes to each test tube and gently rock the test tube back and forth. Be careful! If you rock too hard or shake it, you'll break up the DNA, making it harder to see. (Use meat tenderizer for enzymes. The DNA in the nucleus of the cell is molded, folded, and protected by proteins. The meat tenderizer cuts the proteins away from the DNA. 13. Tilt your test tube and slowly pour rubbing alcohol (70-95% isopropyl or ethyl alcohol) into the tube down the side so that it forms a layer on top of the pea mixture. Pour until you have about the same amount of alcohol in the tube as pea mixture. Alcohol is less dense than water, so it floats on top forming two separate layers. All of the grease and the protein that we broke up in the first two steps move to the bottom, watery layer. DNA will rise into the alcohol layer from the pea layer. 14. Use a wooden skewer to draw the DNA into the alcohol. Only put the skewer into the white layer between the clear and green layers. 15. Carefully twirl the skewer in one direction only; if you are lucky the stuff will wind around the skewer so that you can lift it out through the alcohol layer to look more closely. 16. Answer the self-reflection questions below. Self-Reflection Questions: (Answer in your journal) 5. Does the DNA have any color? 6. Describe the appearance of the DNA. 7. Do only living things contain DNA? Explain. 16. Have one person dispose of the DNA contents in the the sink located on the left side of the counter up against the wall. Place all other materials in the center of your table. If necessary wash your hands. Frequently Asked Questions: 1. I'm pretty sure I'm not seeing DNA. What did I do wrong? First, check one more time for DNA. Look very closely at the alcohol layer for tiny bubbles. Often, clumps of DNA are loosely attached to the bubbles. If you are sure you don't see DNA, then the next step is to make sure that you started with enough DNA in the first place. Many food sources of DNA, such as grapes, also contain a lot of water. If the blended cell soup is too watery, there won't be enough DNA to see. To fix this, go back to the first step and add less water. The cell soup should be opaque, meaning that you can't see through it. Another possible reason for not seeing any DNA is not allowing enough time for each step to complete. Make sure to stir in the detergent for at least five minutes. If the cell and nuclear membranes are still intact, the DNA will be stuck in the bottom layer. Often, if you let the test tube of pea mixture and alcohol sit for 30-60 minutes, DNA will precipitate into the alcohol layer. 2. Why does the DNA clump together? Single molecules of DNA are long and stringy. Each cell of your body contains six feet of DNA, but it's only one-millionth of an inch wide. To fit all of this DNA into your cells, it needs to be packed efficiently. To solve this problem, DNA twists tightly and clumps together inside cells. Even when you extract DNA from cells, it still clumps together, though not as much as it would inside the cell. Imagine this: the human body contains about 100 trillion cells, each of which contains six feet of DNA. If you do the math, you'll find that our bodies contain more than a billion miles of DNA! 3. Isn't the white, stringy stuff actually a mix of DNA and RNA? That's exactly right! The procedure for DNA extraction is really a procedure for nucleic acid extraction. However, much of the RNA is cut by ribonucleases (enzymes that cut RNA) that are released when the cells are broken open. |
|
